
10 Ways to Create Infographics Without Design Skills
No design skills? No problem. Here are 10 tools that let you create professional infographics in minutes:
| Tool | Best For | Starting Price |
|---|---|---|
| Text2Infographic | AI-powered generation | $70 (lifetime) |
| Canva | Beginners & templates | Free |
| Piktochart | Business reports | $29/month |
| Venngage | Business infographics | $19/month |
| Visme | Team collaboration | $29/month |
| Infogram | Data visualization | $25/month |
| Adobe Express | Brand consistency | $9.99/month |
| Snappa | Social media graphics | $15/month |
| Appy Pie | Quick AI designs | $8/month |
| Animaker | Animated infographics | Free |
Key Features Across Tools:
- Drag-and-drop editors
- Pre-made templates
- Stock photos and icons
- Data import tools
- Team collaboration
- Export options
Quick Pick Guide:
- Just starting? → Canva (free)
- Need AI help? → Text2Infographic ($70)
- Working with data? → Infogram ($25/month)
- Team projects? → Visme ($29/month)
- Education use? → Piktochart ($24/month)
The brain processes images 60,000x faster than text, and infographics can boost sales by 80%. Pick your tool and start creating - no design experience needed.
Related video from YouTube
How AI Makes Infographic Creation Simple
AI has turned infographic design from a 15-hour project into a 15-minute task. Here's what's happening:
| AI Feature | What It Does |
|---|---|
| Smart Layout | Picks designs that match your content |
| Data Analysis | Creates charts from your numbers |
| Design Suggestions | Matches colors and fonts |
| Real-time Updates | Refreshes data graphics instantly |
Take Infogram: Paste your numbers, and the AI builds your charts. That's it.
Here's how fast it works now:
- Write what you want
- Click an AI layout
- Drop in your colors
- Download your design
Want proof? The New York Times uses AI to build their COVID-19 tracking visuals. If it works for them, it'll work for you.
Popular AI Tools:
| Tool | Best For |
|---|---|
| Piktochart | Text-to-visual conversion |
| Venngage | Ready-to-use templates |
| Infogram | Data charts |
| Visme | Adding movement |
What You'll Pay:
| Tool | Monthly Cost |
|---|---|
| Piktochart | $14 |
| Venngage | $10 |
| Infogram | $19 |
| Canva | $12.95 |
These tools keep evolving. Microsoft's Copilot helps with presentations, and Text2Infographic turns articles into visuals for $70 (forever).
Teams love these tools too - everyone can jump in and edit the same infographic at once. No more waiting for feedback rounds.
1. Text to Infographic
 Want to turn your text into eye-catching infographics? Text to Infographic does it in seconds. For $70, you get unlimited infographic creation - forever.
Here's what you get:
| Feature | Description |
|---|---|
| Input Options | Blog posts, raw text, spreadsheets, documents |
| Language Support | 20+ languages |
| Customization | Brand colors, logos, design elements |
| Research | Automatic topic research and citations |
| Rights | Full commercial usage rights |
It's super simple to use:
- Drop in your text
- AI does all the work
- Get five infographics in seconds
- Add your branding
Perfect for these content types:
| Content Type | Use Case |
|---|---|
| Blog Posts | Turn articles into shareable visuals |
| Data Reports | Convert statistics into charts |
| Educational Content | Create learning materials |
| Business Updates | Transform updates into graphics |
What's in the $70 lifetime deal?
| Feature | Lifetime Deal ($70) |
|---|---|
| Infographics | Unlimited |
| Updates | Included forever |
| Commercial Use | Yes |
| Brand Assets | Custom logos & colors |
| Topic Research | Automatic |
You handle the content - Text to Infographic handles the design. Paste your text, and boom: you've got professional infographics ready for social media, presentations, or marketing.
2. Canva

Canva makes infographic creation simple with 280+ templates and a huge image library. Here's what you get:
| Feature | Details |
|---|---|
| Templates | 280+ infographic designs |
| Design Elements | Millions of images, icons, illustrations |
| Interface | Drag-and-drop editor |
| File Formats | PNG, JPG, PDF, GIF |
| Team Features | Real-time collaboration |
Making an infographic? Here's how:
- Pick a template: Open Canva, search "Infographics"
- Customize design: Add your colors and fonts
- Add content: Drop in images and graphics
- Export: Download in your format of choice
| Plan Type | What You Get |
|---|---|
| Free | Basic templates, limited images |
| Pro | All templates, Magic AI tools, 500 AI uses/month |
| Education | All premium features for verified educators |
"I LOVE Canva! I use it every day at work. My company does not have a graphic designer to make infographics or certain pictures for our clients, and I can do a lot of that stuff. It is very easy to use, and provides you with TONS of templates to follow." - Austin J.
Want better results? Try these tips:
- Let Magic Studio AI speed up your work
- Set up team accounts for group projects
- Store brand assets for quick access
- Skip the blank canvas - start with templates
The free plan works for basic designs. But for full access to images and AI features, you'll need Pro. Teachers get premium features free, including background removal.
3. Piktochart

Piktochart packs 1,800+ infographic templates and data tools into one platform. Here's what you get:
| Feature | Details |
|---|---|
| Templates | 1,800+ infographic designs |
| Data Tools | Charts, maps, graphs |
| File Types | Images, PDFs |
| Google Integration | Direct link to Google Sheets |
| Price | $29/month or $168/year |
What makes it different:
| Strength | Description |
|---|---|
| Business Focus | Built for reports, presentations, SOPs |
| Data Display | Line graphs, bar charts, pie charts |
| Chart Import | Direct Excel/Google Sheets integration |
| Image Library | Icons, photos, shapes included |
| Download Credits | 2 free credits per workspace |
Making an infographic? Here's how:
- Pick your template from the Visual Dashboard
- Add your data with charts and graphs
- Drop in visuals from the icon library
- Share or download as image/PDF
"Piktochart is the hands-down tool to go to when I want to create more comprehensive decks/reports." - User feedback
Want better results? Here's what works:
- Match templates to your data type
- Use built-in colors (free) or make custom ones (paid)
- Show location data with maps and tables
- Pull chart data straight from Excel
The free plan works for basic stuff. Need more? The Pro plan ($19/month) gets you all templates and unlimited downloads. Teachers get extra perks with education features.
| Plan Type | Features |
|---|---|
| Free | Basic templates, 2 download credits |
| Pro | All templates, unlimited downloads |
| Enterprise | Team features, custom branding |
4. Venngage
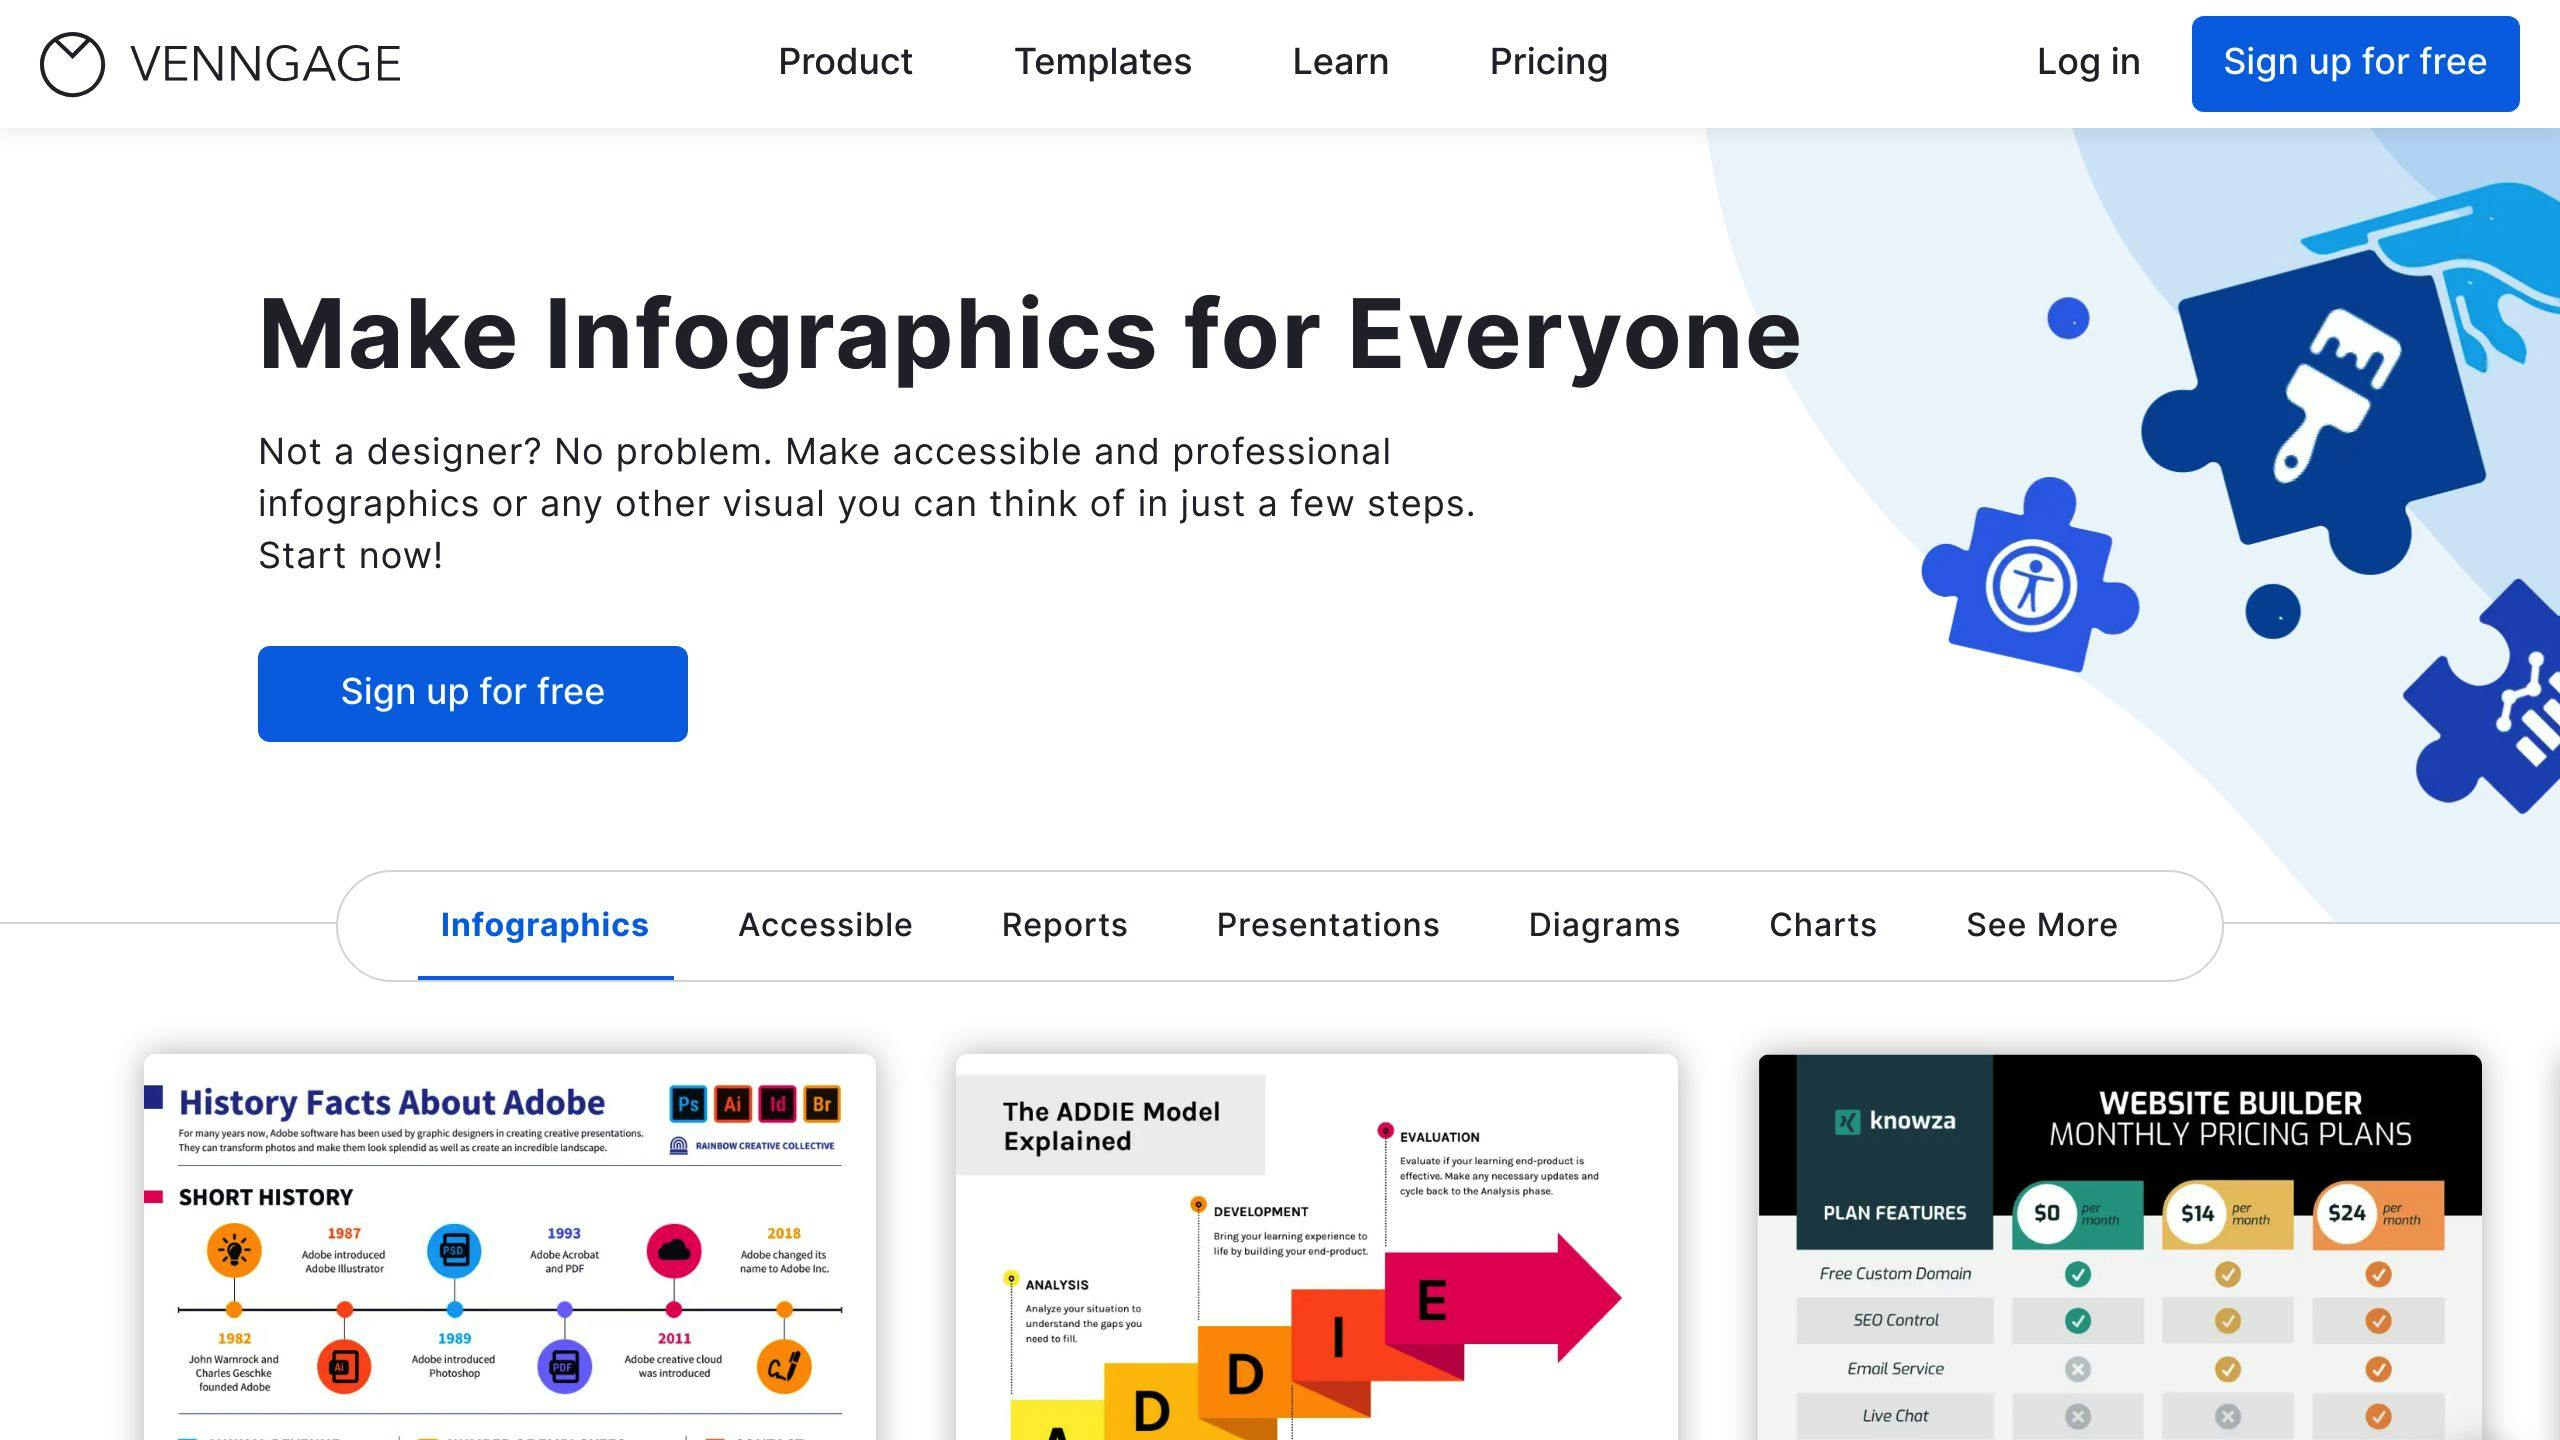
Venngage helps you build business infographics - no design skills needed. You get access to 23,000+ icons and 3M+ stock images to create professional visuals.
| Feature | Details |
|---|---|
| Templates | Process, timeline, comparison infographics |
| Icons/Images | 23,000+ icons, 3M+ stock photos |
| Brand Tools | Custom colors, fonts, logos |
| Data Tools | Charts, graphs, maps |
| File Types | PNG, PDF exports |
The tool works for specific business needs:
| Use Case | Examples |
|---|---|
| Marketing | Reports, social media posts |
| HR | Employee communications, org charts |
| Sales | Pitch decks, product sheets |
| Projects | Roadmaps, timelines, flowcharts |
Here's how to create your first infographic:
- Pick your template: Choose based on your data type
- Add structure: Include clear section headings
- Show your data: Insert charts and graphs
- Highlight key info: Add relevant icons
- Brand it: Apply your colors and fonts
"I use Venngage to create our monthly marketing reports, yearly marketing tool kit, and monthly webinars and communications campaigns." - Verified User, Director, 5 years of experience
| Plan | Price | Features |
|---|---|---|
| Free | $0 | 5 designs, 6 image uploads |
| Premium | $19/month | Unlimited designs, 50 uploads |
| Business | $49/month | Unlimited designs, 500 uploads |
| Enterprise | $499/month | 10+ seats, custom features |
Quick tips:
- Pick templates that match your industry
- Set up 'My Brand Kit' for consistent designs
- Keep your favorite templates handy
- Double-check before you share
Small businesses make up 70% of Venngage users. They choose it because the platform offers business-focused templates with real examples - perfect for turning data into visuals without hiring a designer.
5. Visme
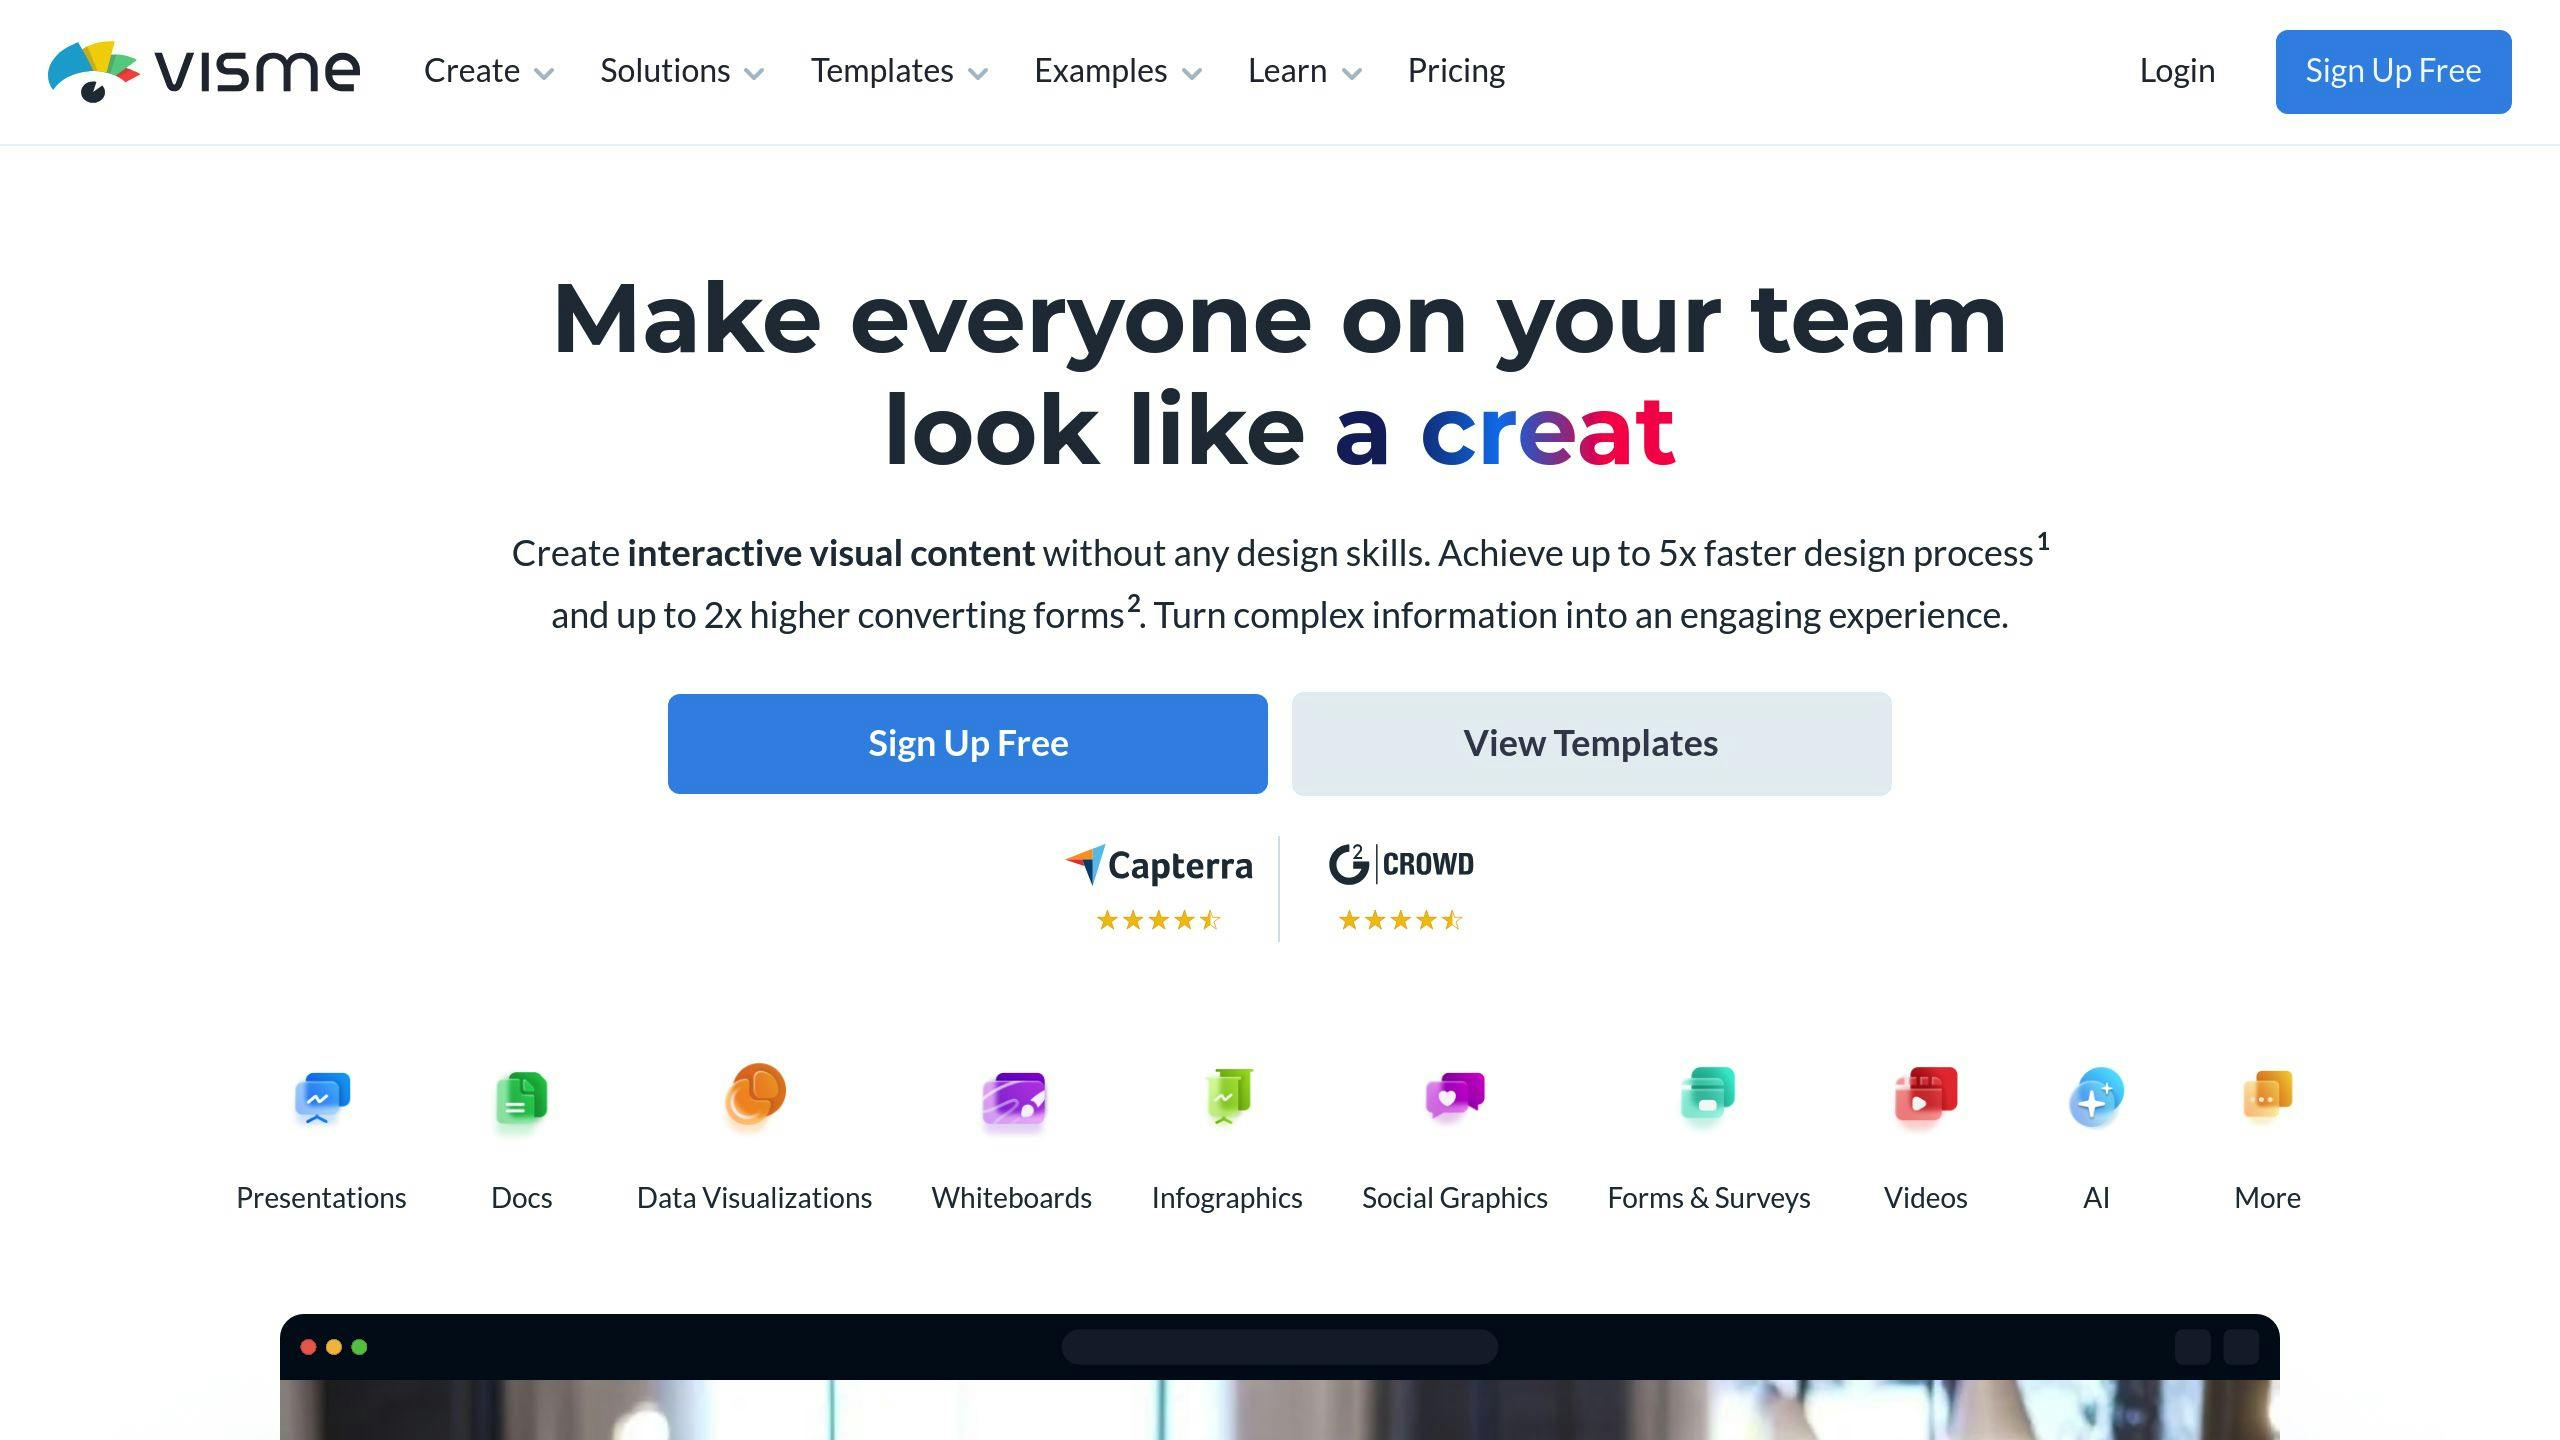
Visme is an infographic maker with a drag-and-drop editor and 14,000+ templates. The platform handles 32,000 new design projects every day from 25.8 million users.
| Feature | Details |
|---|---|
| Templates | 14,000+ infographic templates |
| Stock Assets | 5M+ Unsplash photos (free plan), 4M+ premium images (paid plans) |
| Data Tools | Charts, graphs, data import from spreadsheets |
| Export Options | JPG, PNG, PDF, GIF, MP4, PPTX, HTML5 |
| Storage | 100MB (free) to 3GB (pro plan) |
The platform comes with built-in business tools:
| Section | Purpose |
|---|---|
| Call-to-Action | Add buttons and links |
| Diagrams | Create flowcharts and processes |
| Stats & Figures | Display data points |
| Brand Kit | Save colors and fonts |
Here's a breakdown of pricing and features:
| Plan | Price | Features |
|---|---|---|
| Basic | $0 | Basic templates, Unsplash photos |
| Starter | $29/month | Full template access, premium images |
| Pro | $59/month | Analytics, privacy controls |
| Custom | Custom | Team collaboration tools |
Quick tips:
The data tools set Visme apart:
- Import data straight from spreadsheets
- Build charts and graphs
- Add motion to your data
- Make your infographics interactive
Teams get these tools:
- Share files
- Add comments
- Edit together
- Manage assets
The AI photo picker finds stock images that match your design. Plus, you'll get access to royalty-free music to add to your infographics.
Tips to Get Started:
- Pick a template that fits your data
- Use drag-and-drop for quick changes
- Load your data first
- Keep your brand assets handy
Want to save money? Go annual: Starter costs $12.25/month and Pro drops to $24.75/month (58% off).
sbb-itb-3623b4a
6. Infogram
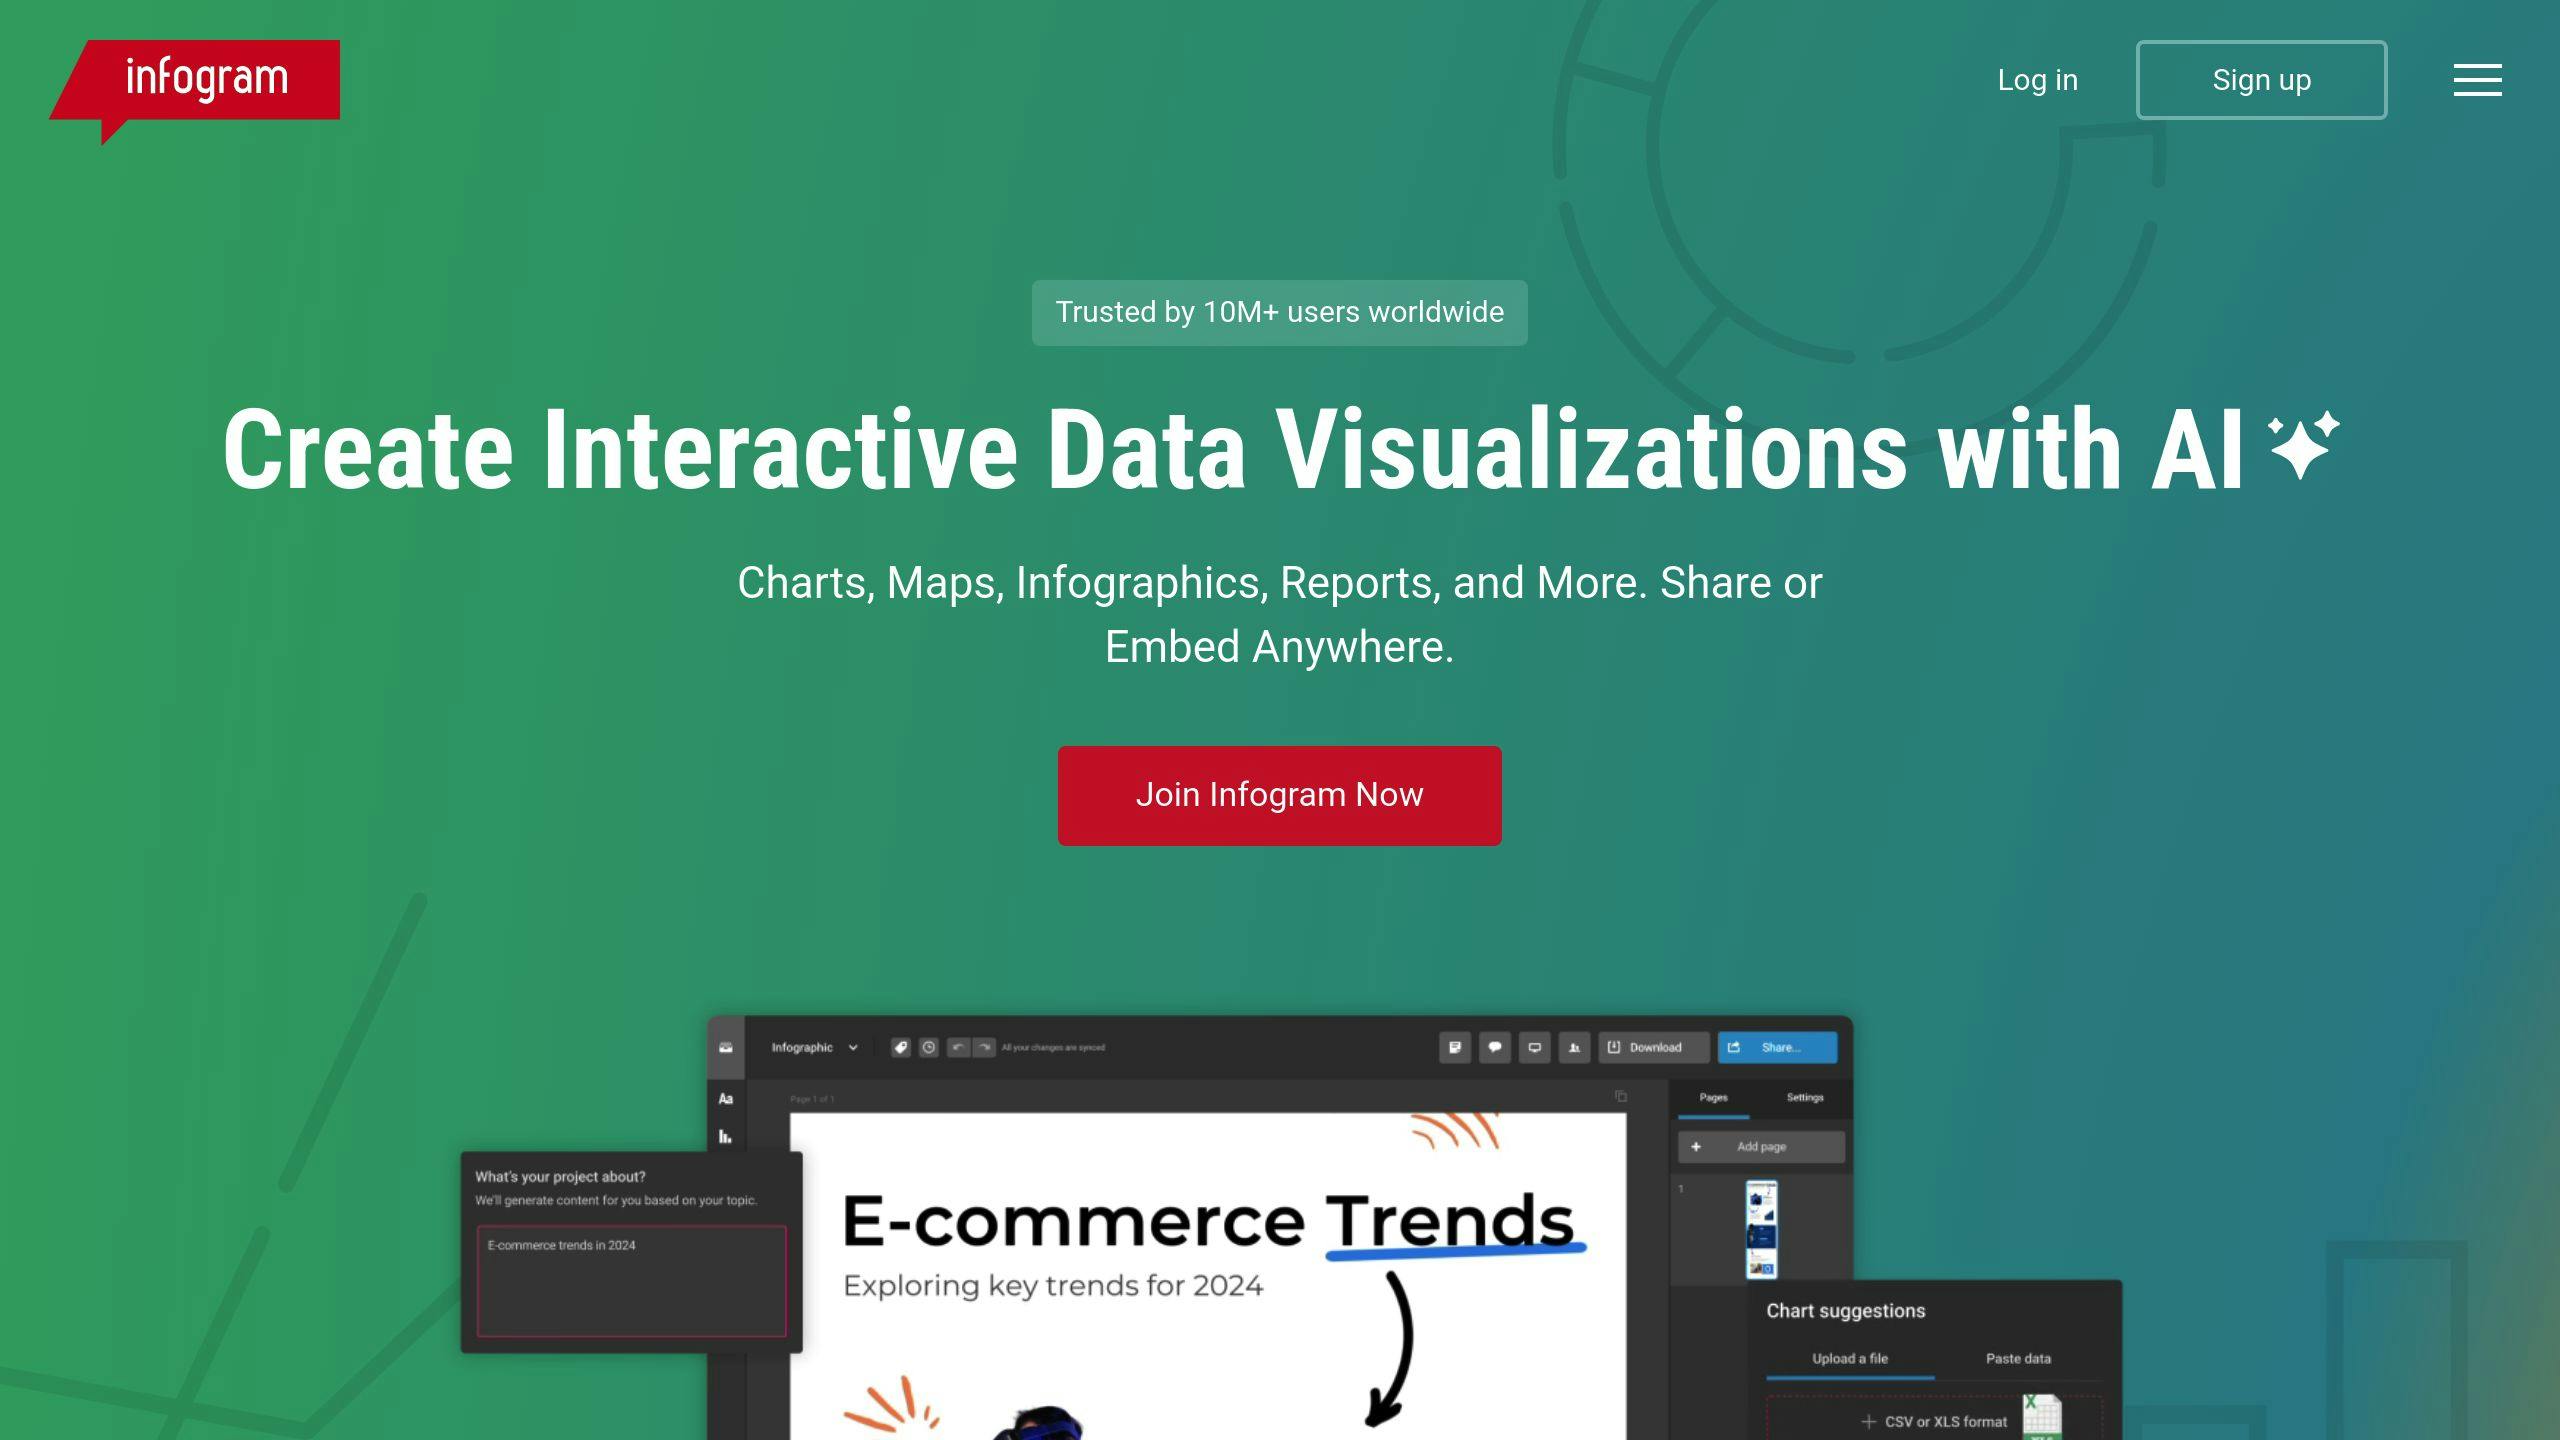
Infogram helps you turn boring data into infographics people actually want to look at. At $25/month (Pro plan), you get a 14-day test drive of their Business features.
| Feature | Details |
|---|---|
| Data Tools | Pull live data, make charts that update on their own |
| Templates | Ready-to-use designs for charts, maps, dashboards |
| Export Options | Web formats you can click and interact with |
| Collaboration | Edit with your team in real-time |
| Storage | Store up to 10,000 projects (Teams/Enterprise) |
Here's what makes their data tools different:
| Data Features | What You Get |
|---|---|
| Live Updates | Hook up to Google Sheets |
| Chart Types | Maps, graphs, timelines |
| Interactivity | Click elements, watch them move |
| Analytics | See who looks at your stuff |
| Brand Tools | Match your company's look |
Want to get the most out of Infogram? Here's what you can do:
- Pull numbers straight from your spreadsheets
- Build charts that update by themselves
- See how people use your infographics
- Jump in and work with your team
Some quick tips:
- Clean up your data first
- Pick charts that tell your story
- Stick to your brand's style
- Add stuff people can click on
You can use Infogram pretty much anywhere:
- Through your web browser
- On your computer
- On your phone
- With your team
Teams get extra perks:
- Share projects
- Work together
- Keep files organized
- Track who's using what
Users give it 4.5/5 stars for being easy to use - you don't need to be a design pro to make things look good.
Want to save some cash? Start with the free Teams/Enterprise demo. You'll know if the fancy features are worth paying for.
7. Adobe Creative Cloud Express
Adobe Express puts Adobe's design tools right in your browser - no complex software needed. Here's what $9.99/month gets you with Premium:
| Feature | What You Get |
|---|---|
| Templates | Thousands of infographic layouts |
| Stock Assets | Adobe Stock photos and graphics |
| Storage | 100GB cloud space |
| Fonts | Full Adobe Fonts library |
| Quick Actions | One-click design tasks |
Want to start free? You'll get:
| Free Features | Details |
|---|---|
| Basic Templates | Core design layouts |
| Storage | 2GB cloud space |
| Photo Effects | Basic editing tools |
| Animation | Simple motion effects |
Create these (and more):
| Content Types | Use Cases |
|---|---|
| Social Graphics | Posts, stories, ads |
| Infographics | Data visualization, timelines |
| Email Headers | Newsletter graphics |
| YouTube Thumbnails | Video covers |
| Logos | Brand identity |
Making infographics? Here's how:
- Pick your size based on where you'll share it
- Browse templates that fit your data
- Set your brand colors and fonts
- Add icons to support your message
- Make text easy to read
Pick your plan:
| Plan | Cost | Best For |
|---|---|---|
| Free | $0 | Basic designs, personal use |
| Premium | $9.99/month | More features, storage |
| Teams | $12.99/user/month | Business use, collaboration |
Want to save? Pay yearly and get 16% off Premium.
Just open your browser and start designing - it works on both desktop and mobile. No downloads, no waiting.
8. Snappa
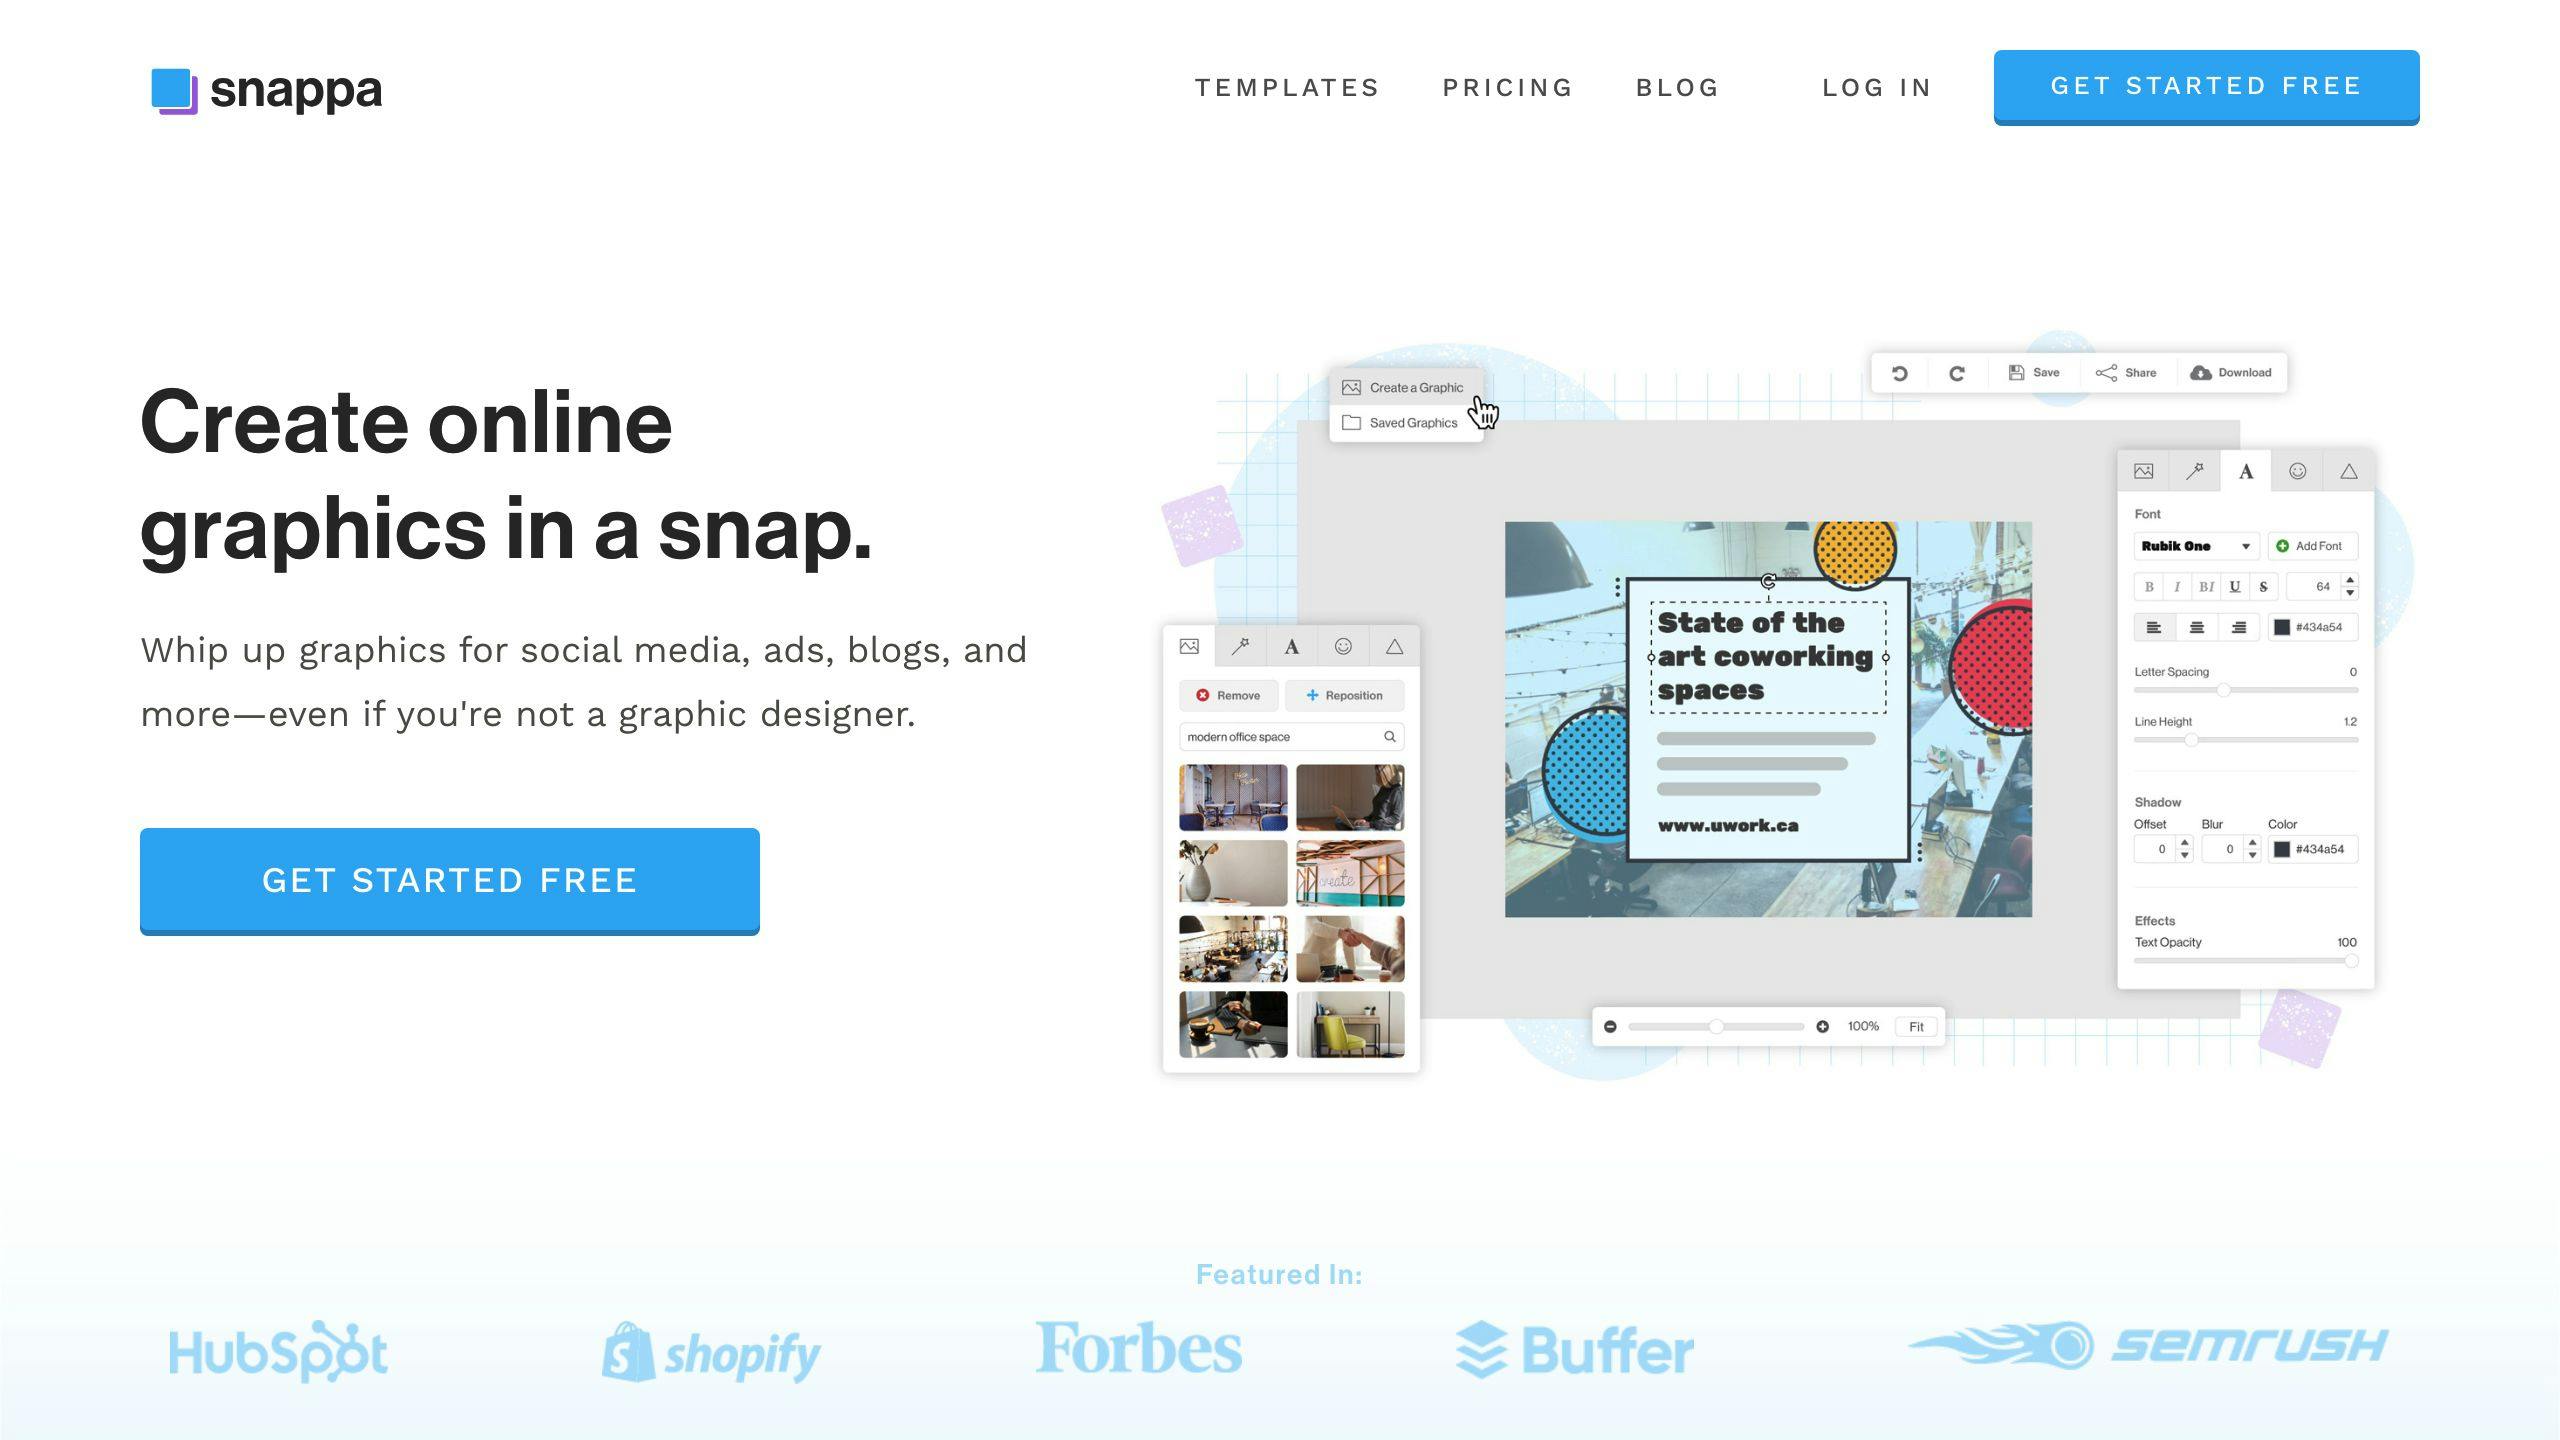
Snappa is a drag-and-drop tool that lets you create infographics without design skills. Here's what you get:
| Feature | Details |
|---|---|
| Templates | 6,000+ ready-to-use designs |
| Stock Assets | 5M+ HD photos and graphics |
| Graphics | 100,000+ vectors and shapes |
| Fonts | 200+ font options |
Here's what each plan costs:
| Plan | Cost | Features |
|---|---|---|
| Free | $0 | • All templates and HD photos • 3 downloads per month • Unlimited saved designs |
| Pro | $15/month | • Unlimited downloads • Social media sharing • Custom font uploads |
| Team | $30/month | • 5 user accounts • Team sharing features • All Pro features |
Want to save money? Go yearly: Pro costs $10/month and Team drops to $20/month.
What makes Snappa different:
- Built-in social media sizes
- Quick brand color/logo setup
- 4M+ stock photos
- High-res exports
- Direct social posting
Plus, you get these time-savers:
- Remove backgrounds in one click
- Auto-resize images
- Post straight to social media
- Connect with Buffer
The numbers speak for themselves: Since 2015, users have created 25M+ images on Snappa. In year one, they went from zero to 1,500 paying customers.
Quick tip: The free plan includes templates and HD photos (most competitors don't). Try it first - only upgrade if you need more than 3 downloads per month.
9. Appy Pie
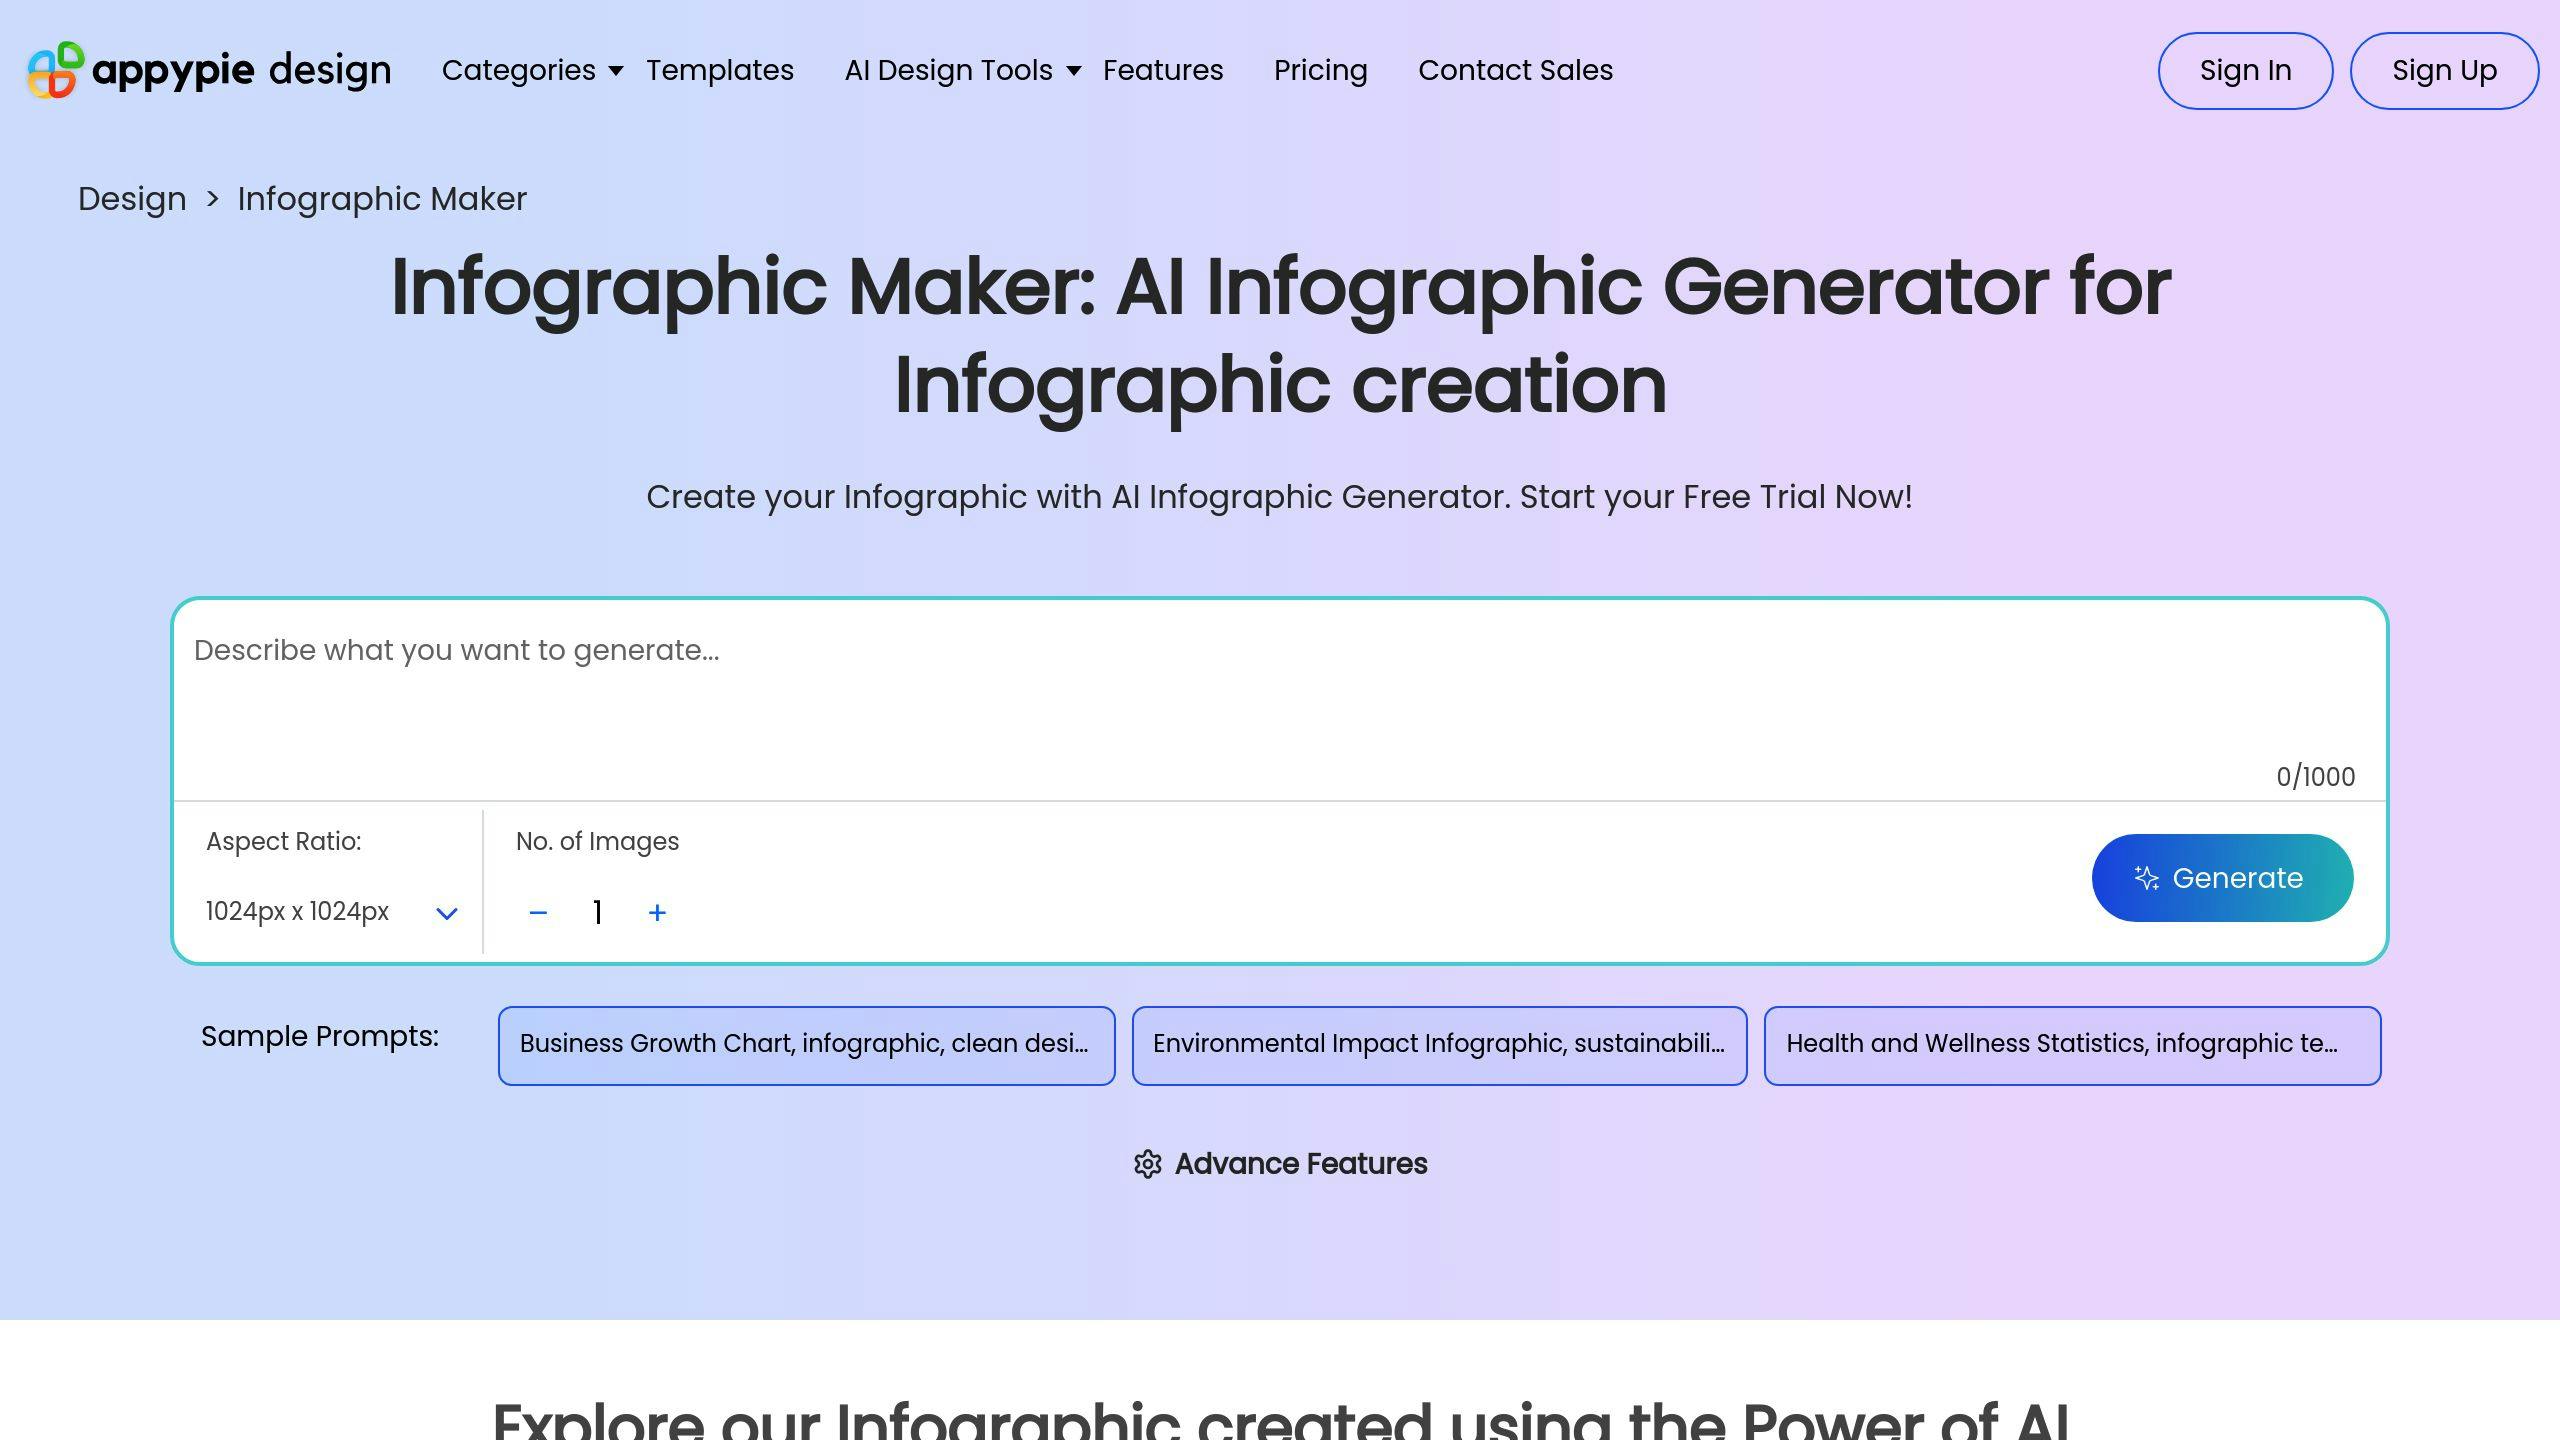
Appy Pie's AI Infographic Maker turns your ideas into infographics fast. Here's what you get:
| Feature | Details |
|---|---|
| Templates | 500,000+ AI-generated designs |
| AI Art Generator | Makes visuals from text descriptions |
| File Formats | Multiple export options |
| Credits | 5 free credits to start |
Here's what each plan costs:
| Plan | Cost | What's Included |
|---|---|---|
| Free Trial | $0 | • 5 credits • 7-day access • Basic features |
| Monthly | $8 | • 15 credits • All AI features • Full template access |
The numbers speak for themselves: 10 million+ businesses use Appy Pie, with a 4.58/5 rating from 386,006 reviews.
Making an infographic is simple:
- Choose an AI template
- Drop in your content
- Pick your file format
- Share or print
Want to save money? Start with the free trial. You'll get 5 credits to test everything before spending a dime.
Need custom images FAST? The AI Art Generator turns your text into visuals when stock photos won't cut it.
The tool keeps it basic with:
- Ready-to-use templates
- Simple drag-and-drop tools
- Basic design options
- Quick downloads
Bottom line: Appy Pie works best for simple infographics. It's not as loaded with features as Canva or Snappa, but it's perfect when you need an AI-powered tool to create something quickly.
10. Animaker
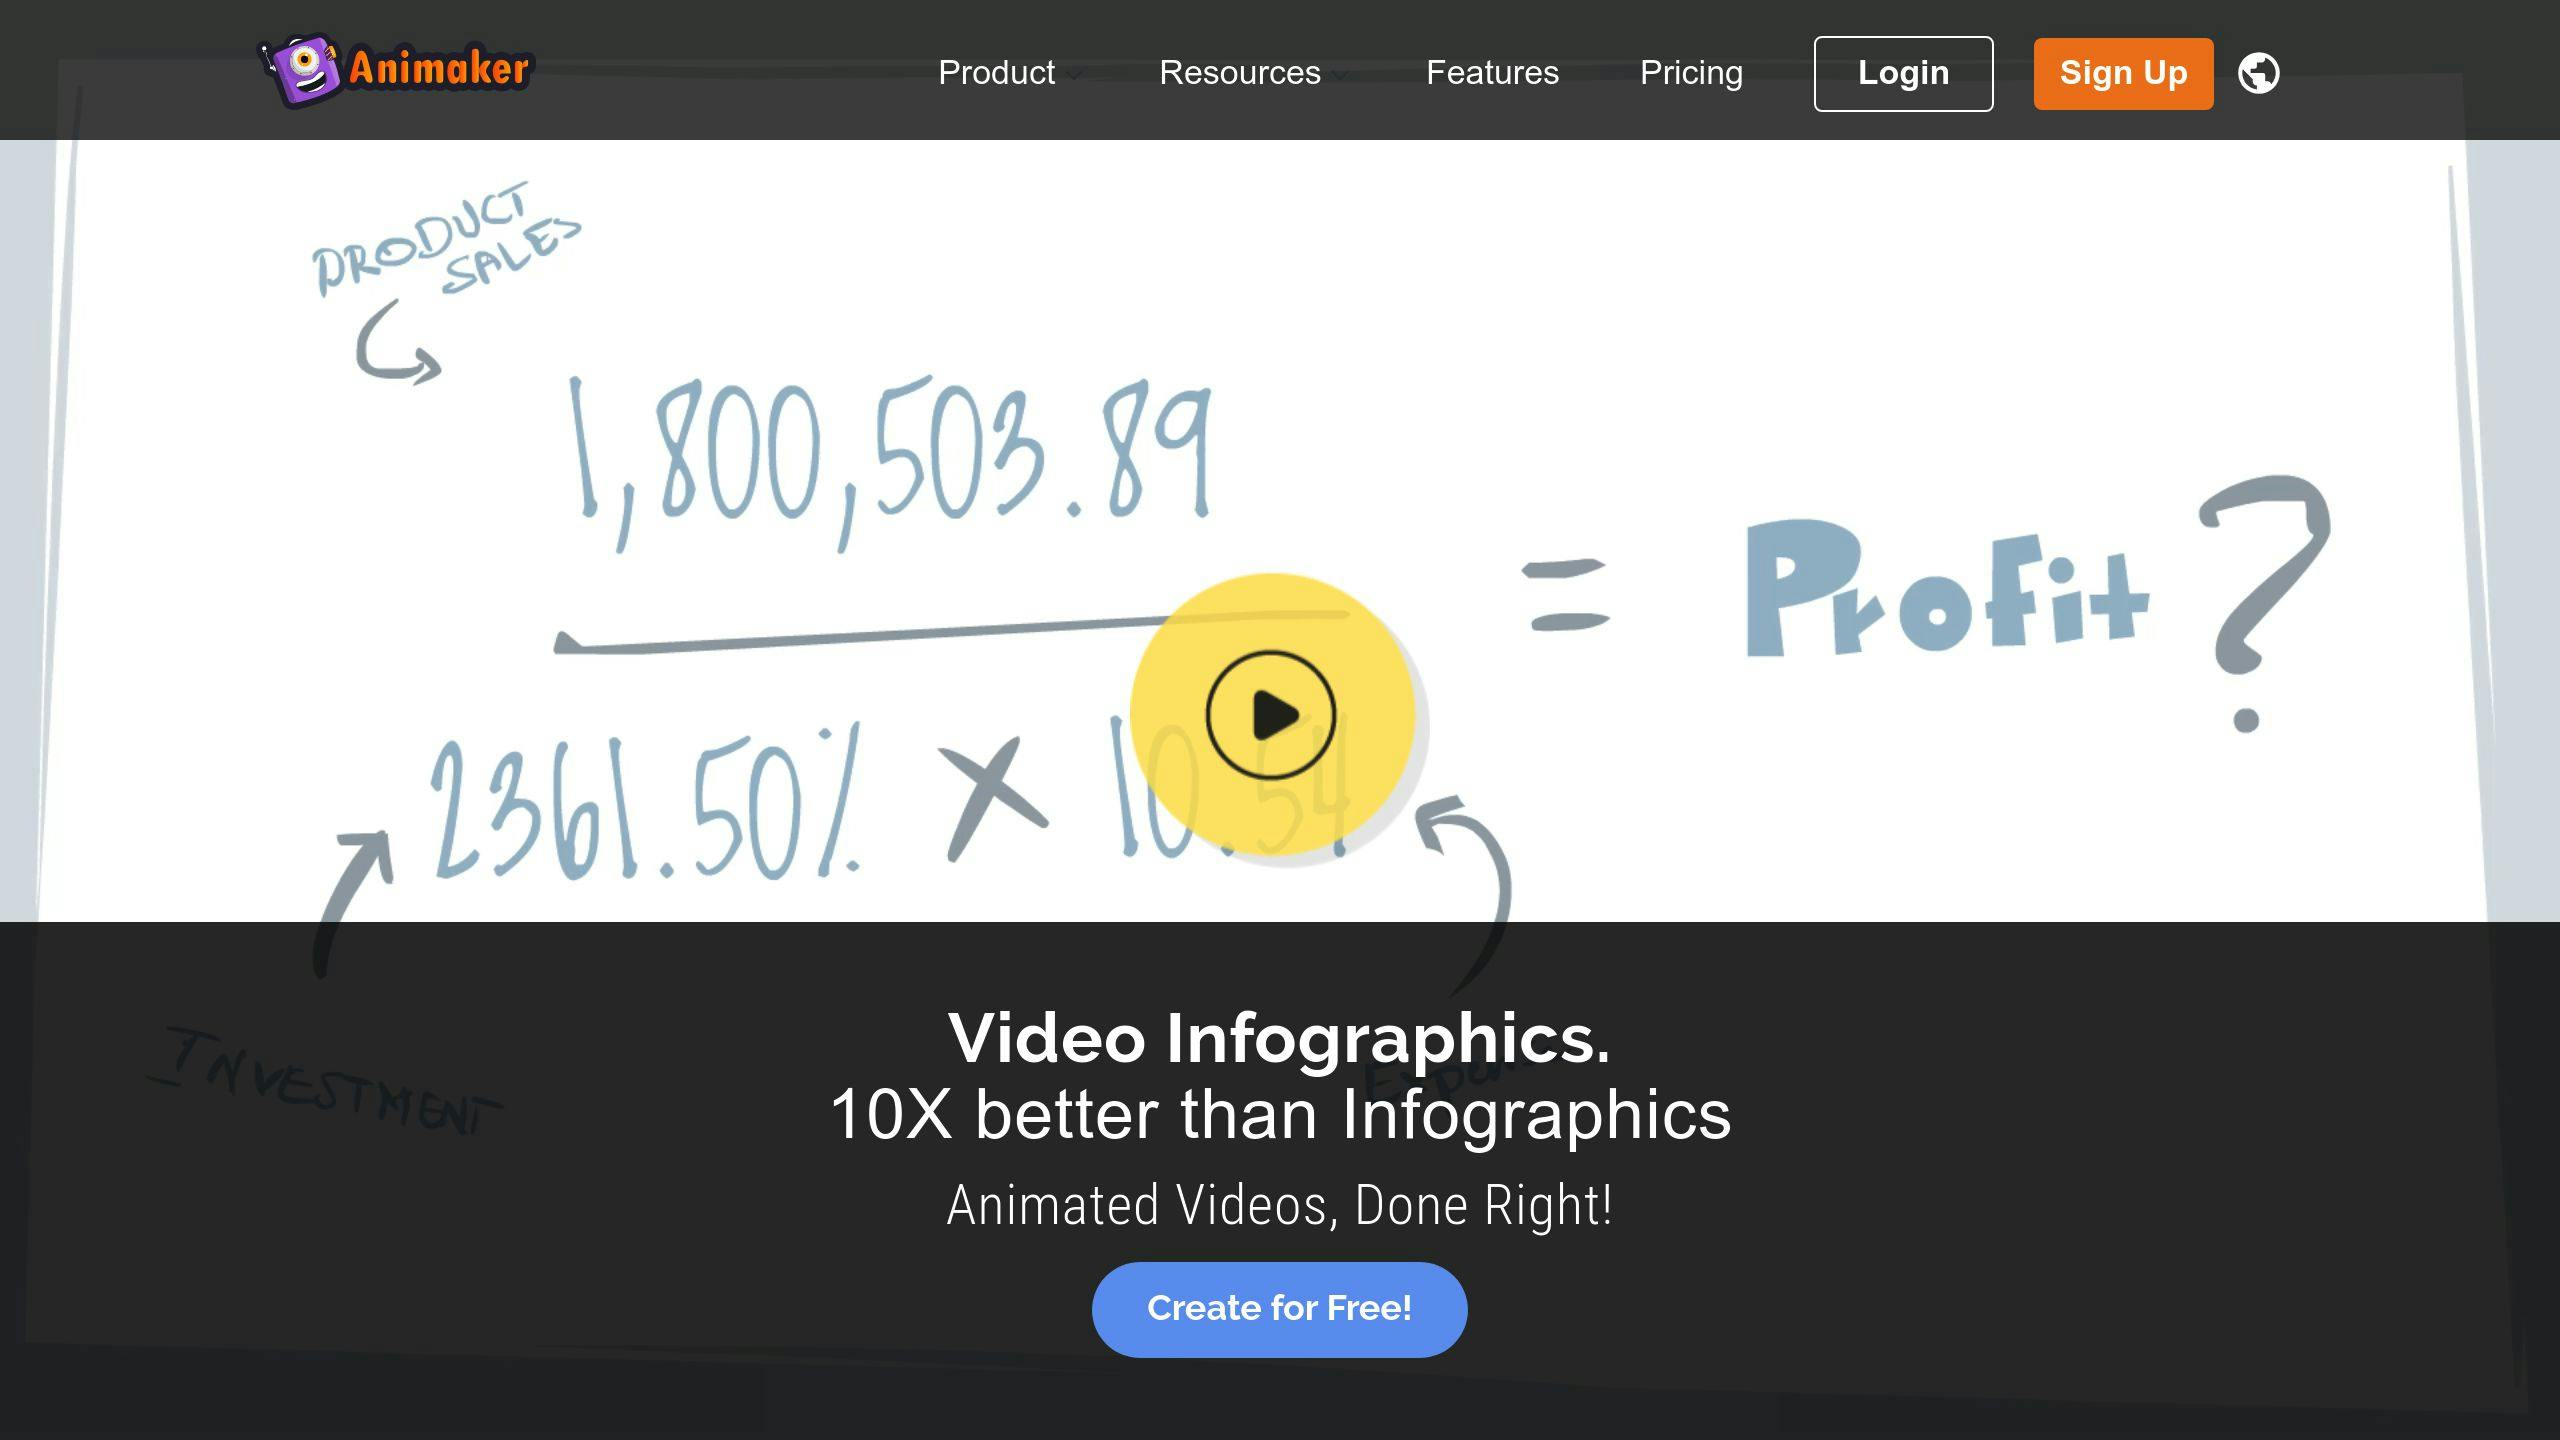
Animaker lets you build infographics - both static and animated - without design experience. Here's what's inside:
| Feature | Details |
|---|---|
| Interface | Drag-and-drop editor |
| Templates | Ready-to-use designs |
| Animation | Moving maps, graphs, charts |
| Export Options | Facebook/YouTube sharing (free plan) |
| Scene Management | Timeline editor |
Here's how the pricing breaks down:
| Plan Type | Cost | Features |
|---|---|---|
| Free | $0 | • Basic templates • Facebook/YouTube export • Limited assets |
| Education | $10/month per teacher | • More creation tools • Extra sharing options • Student management (25 students) |
| Student | $0.02/month | • Access to class features • Assignment submission • Basic tools |
Creating an infographic is simple:
- Choose a template or start fresh
- Drop in your content
- Add animations
- Export your work
"At first, Animaker's tools aren't easy to spot. But once you start using it, everything clicks. The more you work with it, the more natural it feels." - Annissa C., Verified User in Primary/Secondary Education
Best for: Small businesses and teachers who want both static and moving infographics. Small businesses make up 77.8% of Animaker's reviews.
Time investment: One hour gets you a six-scene video infographic, no tutorials needed.
The tool shines for:
- Product demos
- Teaching materials
- Data stories
- Student work
Watch out: The FLASH-based platform might run slower than newer tools.
Next Steps
Want to create your first infographic? Here's how to do it:
1. Pick Your Tool
| Need | Tool | Price |
|---|---|---|
| AI Generation | Text2Infographic | $70 (lifetime) |
| Basic Templates | Canva | Free |
| Data Charts | Infogram | $19/month |
| Team Projects | Visme | $29/month |
| Education | Piktochart | $24/month |
2. Set Up Your Space
Make an account, grab a template, add your brand colors, and set up team access if you need it.
3. Start With Something Simple
| Project | Time | Tool |
|---|---|---|
| Basic Stats | 15 min | Canva |
| Process Flow | 30 min | Piktochart |
| Data Chart | 20 min | Infogram |
| Timeline | 25 min | Visme |
4. Create Your Design
Pick a template, drop in your data, add your branding, and export.
5. Share It
| Where | Format | Size Limit |
|---|---|---|
| Website | PNG/SVG | 5MB |
| Social | PNG | 2MB |
| JPG | 1MB | |
| None |
Here's what works:
- Test tools with free plans first
- Keep your first design quick (under 30 min)
- Focus on ONE key message
- Use templates (don't start from scratch)
- Save often
Fun fact: 88% of marketers use visuals in their content. Now you can too - no design skills needed.
FAQs
What is the best AI tool to create infographics?
Here's what you need to know about the top AI infographic tools:
| Tool | Best For | Starting Price | Key Feature |
|---|---|---|---|
| Text2Infographic | Quick AI Generation | $70 (lifetime) | Automatic Topic Research |
| Appy Pie | Custom Animations | $17/month | Video Integration |
| Canva | Template Variety | Free | 250,000+ Templates |
| Visme | Team Projects | $29/month | 14,000+ Templates |
| Piktochart | Education | $29/month | Data Visualization |
Want the bottom line? Canva is your best bet if you're just starting - it's free and super easy to use. Need AI to do the heavy lifting? Text2Infographic lets you make unlimited infographics for a one-time fee.
Here's a quick guide to pick the right tool:
| Usage | Best Tool Choice |
|---|---|
| Personal Projects | Canva Free |
| Business Use | Visme |
| Data Heavy | Piktochart |
| Quick AI Creation | Text2Infographic |
| Team Collaboration | Canva Teams |
Bottom line: Pick based on what you need:
- Just getting started? Go with Canva's free plan
- Want AI to help? Text2Infographic is your friend
- Working with a team? Look at Visme or Canva Teams
- Making lots of charts? Piktochart's got you covered